Author: Richa Jha, India, Ambassador @RemakeOurWorld, Member @UCRF
Aim of the study
It was a fact-finding study to create awareness and behavioural change.
The objective of the study
The objective of the study was to find the shopping preferences and volume of clothes owned by an average Indian woman and a man.
What has influenced or inspired your approach?
I was influenced by the Wardrobe studies on this blog and particularly influenced by The Plastic Elephant Report, which said that poor fit and quality leads to wardrobe surplus and in-turn to over-consumption and over-production. Hence, I was curious to find similar statistics for India.
Method
- An online questionnaire was circulated to individuals from different cities and professions. The questionnaire was sent to over 400 individuals out of which 105 chose to answer voluntarily.
- There were questions such as – How many clothing items they buy? How many times a year? How many clothing items they own by category such as t-shirts, trousers, sarees, etc.? How many items they discard? Do they opt for repair, why not?
- The income class of the respondents was middle class and above, i.e. Rs 500,000 per year
- 70% of the respondents were women and balance were men.
- More than 56% were Gen X, another 31% millennials, and 12% Gen Z. More than 56% were from Metros, 36% from Non-metros and the balance 9% were living outside of India.
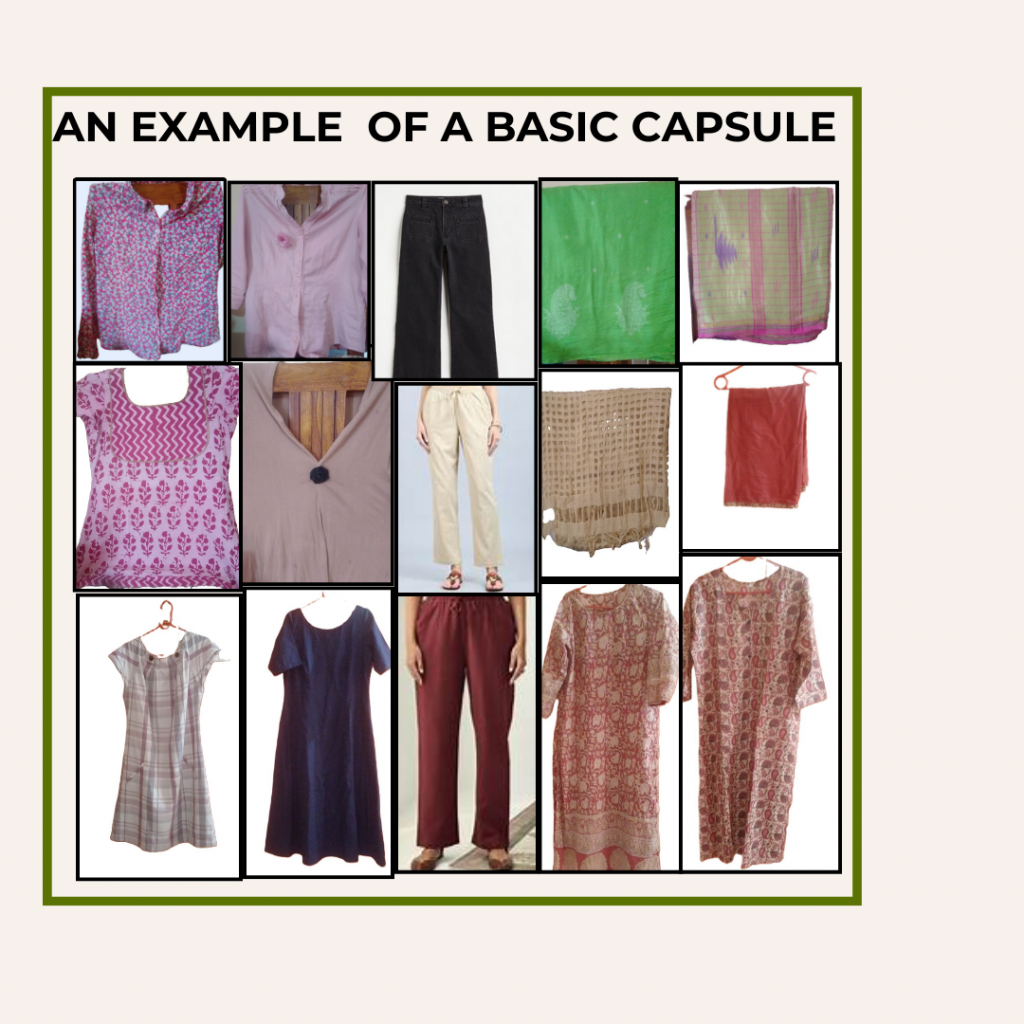
- Calculation of average wardrobe size – In the questionnaire, respondents were asked to tick mark the count for each clothing type such as Trousers, Shirts, T-shirts, Coats, Indian Wears, among others. The ranges were 0-5, 6-10, and so on till more than 30. The wardrobe volume is calculated by adding the average numbers for each clothing type for each individual.
Key findings of study
The majority of the respondents shop up to 10 items annually and the average discard rate is also 10 items per person per year.
The volume of clothing owned (by this group) ranges from 30 to 308 in case of women and 27 to 162 in case of men. The mean is 120 for women and 80 for men. For millennial women, average is 110, on the other hand for Gen X it is 130. This suggests that women’s collection grow as they age, over time, they tend to accumulate Indian traditional wear such as sarees.
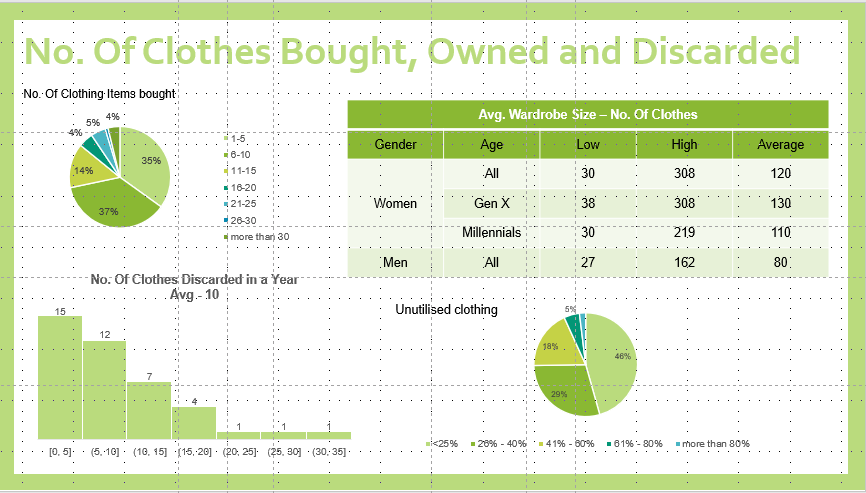
1 in 4 respondents do not use more than 40% of their wardrobe. The reasons for not utilising the wardrobe fully were occasional wears, woollens, fit issues, out of fashion and lifestyle changes in that order.
Only 20% of the respondents do not opt for repairing their clothes, on the contrary only 13% opt for upcycling. Among those who do not repair or do not opt for professional repair, majority do not see any value in repair or feel that new clothes are available at affordable rates.
The utilisation of the garment is optimum as most people said that they wear the garment till it fades or is worn out. Only for occasional wear or in some cases for formal wears, the number of wears is less. Some respondents mention they prefer to give to charity rather than repairing or upcycling.
But 80% of the respondents are willing to get their clothes repaired through a professional service and are willing to pay 15-20% of the original cost of the dress.
What happened after the study/exercise? What did you do with the results? Did you meet your objectives? How? How were the data used?
The report was shared with all the respondents. It gives them an idea as to where they are as compared to the average and hence may lead to self-induced behavioural change. Link to the report here.
A discussion was held with Sustainable Fashion Advocates from RemakeOurWorld. It further brought out the “whys” from the data such as cultural reasons.
The findings are also used to create awareness campaign through social media.
How could this specific method be used by others (or is it used already)? What are other insights/results that this method can generate?
Quantitative surveys are the most commonly used data collection method in Market Research.
How could the results of your study/experience be used by others (or are they used already)? What is the most important experience you want to share with those who are new to wardrobe studies?
- Need for bigger and scientifically chosen sample if conducting a quantitative study
- In the count, have zero/none separately from lower counts, i.e. instead of having 0-5, have none, and 1-5
What insights does this method generate?
It gives quantitative data on the total volume of clothes owned and clothing type. Filling this survey itself was an eye-opener for many and for them to realise their ownership, usage and surplus. The questions on repair and upcycling will also lead to plausible solutions, such as repair, alter, resale, lend or rent to increase wardrobe utilisation.
References
The Plastic Elephant – access here.
How clothing affects climate change? – access here.
Nielsen Woolmark Study – access here.
Appendix: Definitions of some terms
Metro – Metropolitan areas – Such as National Capital Region of Delhi, Mumbai, Bangaluru, Hyderabad, Ahmedabad, Pune and Jaipur
Non – Metro – All other Tier-2 and 3 Towns such as Indore, Dehradun, Rajkot, Bharuch, Coimbatore, Trivandrum, Ludhiana etc.
Saree – a garment consisting of a length of cotton or silk elaborately draped around the body, traditionally worn by women from South Asia.
Lehenga – Lehenga is a three-piece ensemble consists of the actual lehenga, a long ankle-length skirt, a well-fitted blouse top known as the choli, and a scarf to drape around the outfit, known as the dupatta.
Gen X – 43 to 58 Years I Millennials – 27 to 42 Years I Gen Z – 18 to 26 Years