Author: Rita Dominici
Introduction
Various textile management policies are under debate, with particular attention to the effectiveness of weight-based eco-modulation, a policy strategy aimed at minimizing the environmental impact of products (Lifset et al., 2023). To better understand this mechanism, it is important to first know that fashion is widely regarded as “one of the least regulated industries” (Bédat, 2022), in which efforts to achieve a sustainable approach to clothing production are primarily individual and voluntary. In fact, existing policies aim to encourage sustainability and limit environmental damage, but they do not constitute strict international obligations with shared parameters. Indeed, these should be seen more as guidelines that individual nations can modify according to their own norms and priorities. An example is the Extended Producer Responsibility (EPR): an environmental policy defined by the Organisation for Economic Co-operation and Development (OECD) that makes producers responsible for the entire life cycle of their products, from design to waste management. Among its aims is to encourage producers to adopt sustainable production and design practices for durable, repairable, and recyclable products, making production more sustainable. Even though it was not created specifically for textile products, it has since begun to be applied to them as well (Bukhari, Carrasco-Gallego, Ponce-Cueto, 2018). The estimation of the fees for textile products usually depends on several factors, one of which can be weight. For example, in the Netherlands, the PRO UPV Textiles Foundation set a fee of 0.10 € per kg of textiles put into the market in 2024 (Simas and Arega, 2025).
This consideration of weight is particularly relevant given that although textile waste constitutes a relatively small percentage of overall waste by weight, its environmental impact is significant and continues to grow, especially during the last decades (Bukhari, Carrasco-Gallego, and Ponce-Cueto, 2018). This trend is closely linked to the substantial increase in textile production, which has been driven almost fully by synthetic fibers. These fibers now represent over two-thirds of all materials used in textiles, and more than half of all textiles contain synthetics (Changing Markets Foundation, 2023; Henry, Laitala; Klepp, 2019). For this reason, it is crucial to take into account the diversity of fibers used in clothing: some are natural, others synthetic, and each of them has a specific environmental impact, which is generally higher for synthetic fibers than for natural ones (Muthu et al., 2012). This difference in fiber type leads to varying densities, causing weight variations even when considering the same number of garments (Watson et al., 2014). Therefore, our main question is: “Do garments made of synthetic fibers weigh less than garments made of natural fibers?”
| FIBER | DENSITY (g/cm3) |
| Cotton | 1.55 |
| Viscose | 1.52 |
| Polyester | 1.39 |
| Silk | 1.34 |
| Wool | 1.30 |
| Acrylic | 1.19 |
| Nylon | 1.14 |
| Polyethylene | 0.95 |
| Polypropylene | 0.91 |
Data and Methods
This analysis is based on quantitative data collected by PhD candidate Anna Schytte Sigaard for her doctoral project “Want Not, Waste Not”, which is part of a larger project entitled “Wasted Textiles: Reduced Synthetic Textile Waste Through the Development of a Resource-Efficient Value Chain”.
The data were originally gathered using wardrobe methods, involving 28 households in three Norwegian regions: Oslo, Vestfold, and Salten. Due to limitations in sample size, the 28 households cannot ensure representativeness of the Norwegian population. However, the dataset provides a substantial number of textile observations, offering valuable insights. The participating households were asked to collect all textiles that would have otherwise been thrown away, donated to charity, given away, or disposed of in any other way over a six-month period. These items were later registered along with information from the interviews. The first household began the collection in October 2021, and the last one completed it in October 2022.
Although the project primarily used qualitative methods, the data were extracted and transformed into quantitative form.
In total, 3556 individual pieces, amounting to 554.5 kg of textiles, were originally registered. Since this analysis only focuses on adult clothing, 1306 individual garments, amounting to 221.34 kg of textiles, were taken into consideration. Moreover, from the 91 original variables, the ones used for the analysis were: Clothing Type, Merged Clothing Type, Weight, Fiber Content, Synthetic Fiber, and Non-synthetic Fiber, Cotton and Polyester.
The variable “Clothing Type” includes 1306 observations and comprises 23 categories: Blazer, Blouse, Cardigan, Dress, Sweatshirt, Jeans, Jumpsuit, Maternity Wear, Outerwear, Pants, Pantyhose, Pyjamas, Shirt, Shorts, Skirt, Socks, Sweater, T-shirt, Tights, Top, Underwear, Vest, and Workout Clothes. From this variable, the “Merged Clothing Type” variable was created by merging some of the original categories by creating 10 final ones: Heavy Lower wear (including “Pants”, “Pantyhose”, “Jeans”), Activewear, Heavy Upper wear (including “Sweater”, “Sweatshirt”, “Cardigan”), Light Lower wear (with “Skirt”, “Shorts”), Light Upper wear (including “T-shirt”, “Top”, “Blouse”, “Shirt”, “Vest”), Jacket (with “Outerwear” and “Blazer”), Maternity wear, One-Piece (including “Dress” and “Jumpsuit”), Pyjamas and Underwear.
The variable “Weight” provides information on the weight in grams of each of the 1306 garments.
As clothing fibers, they can be classified into two main categories: synthetic and non-synthetic. Natural (non-synthetic) fibers occur in nature and include materials like cotton, wool and silk, while synthetic fibers are man-made, such as polyester, nylon, and acrylic (Chen et al., 2021). In this analysis, the variables “Synthetic Fiber” and “Non-synthetic Fiber” indicate the amount of each fiber type present in the 1306 garments examined. Using this information the variable “Fiber Content” was created, which includes 3 categories: “Mostly Synthetic” (over 70% of fibre content non-synthetic), “Mixed Material” (between 31-69% of both synthetic and non-synthetic) and “Mostly Natural” (over 70% of fibers are synthetic).
The variables “Cotton”, and “Polyester” include information regarding the quantity of the respective material used in the production of each individual garment.
Therefore, the analytical sample is composed of 1306 observations.
After the operationalization of all relevant variables, the analysis will consist of descriptive statistics produced using the statistical program R. In particular, stacked bar charts will be used to visually represent the composition of garments by clothing type, fiber composition and weight. Moreover, to answer the research question, a Welch T-test was employed to compare the average weight of garments made of synthetic versus natural fibers in specific categories, such as dresses and pants. Afterwards, a one-way ANOVA was performed to test for significant differences in the weight of garments based on fiber composition across clothing categories. This was followed by post-hoc Tukey tests to identify pairwise differences. Lastly, a hierarchy regression was run to evaluate the explanatory power of synthetic fiber content in predicting garment weight.
Results
In order to answer the research question, this section presents the findings of the study, detailing the composition of synthetic and non-synthetic fibers across various clothing categories
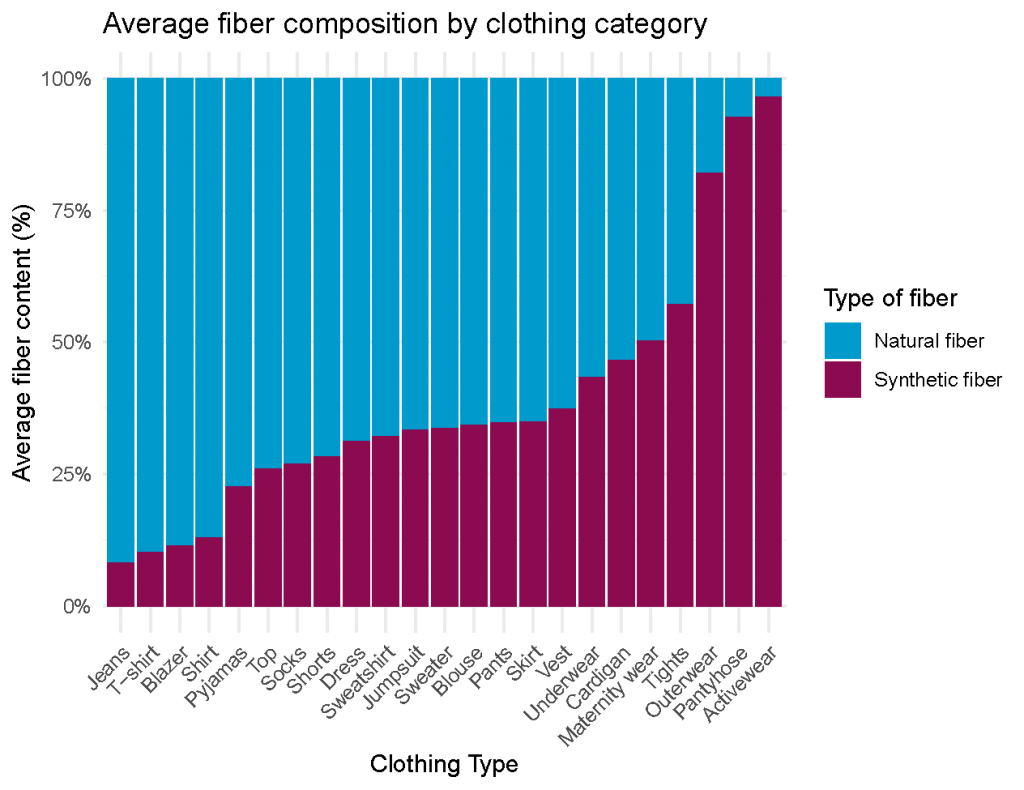
Fig. 2 shows how different clothing categories, ordered by their average synthetic fiber content, vary in terms of fiber composition. It emerges how synthetic fibers are not equally distributed across all clothing types, for example, on average, some garments, such as “Activewear” and “Pantyhose”, contain a higher percentage of synthetic fibers, while others, like “T-Shirt” or “Jeans”, tend to have higher content of natural fibers.
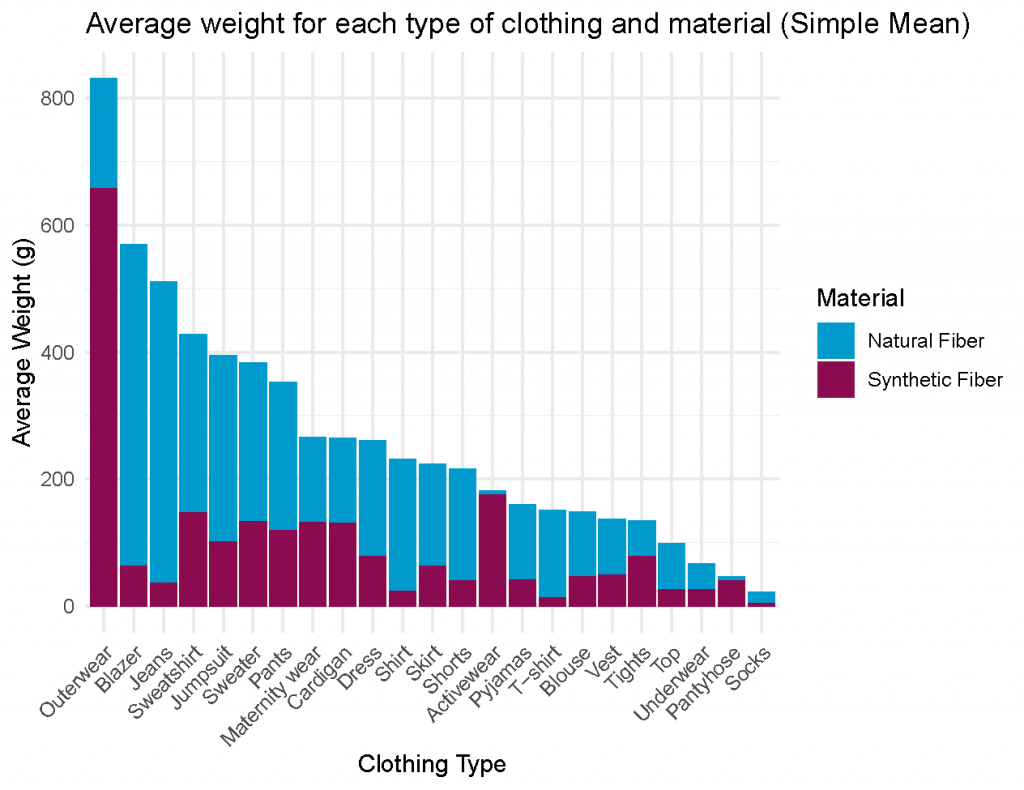
After better understanding the average fiber composition in the different clothing categories, Fig. 3 also takes into consideration the average weight of the garments and the amount of synthetic and natural fibers they contain. This analysis multiplies the percentage of each fiber type by the weight of the garment to estimate the fiber-specific contribution to weight. From the results it emerges that, although not weighing more in absolute terms across all the clothing categories, natural fibers may contribute significantly to garment weight, especially in categories like “Blazer” and “Jeans”. This may be because natural fibers (such as cotton or wool) are generally heavier than synthetic ones. It is also important to note one limitation of this graph: the calculation considers the percentage composition of the garment along with its weight, without considering that different materials have different specific weights. This means that the same quantity of a certain material may weigh more or less than another. Nevertheless, even if the varying densities of the materials were considered, it is ultimately the way these materials are processed that determines how much they affect the final weight of the garment.
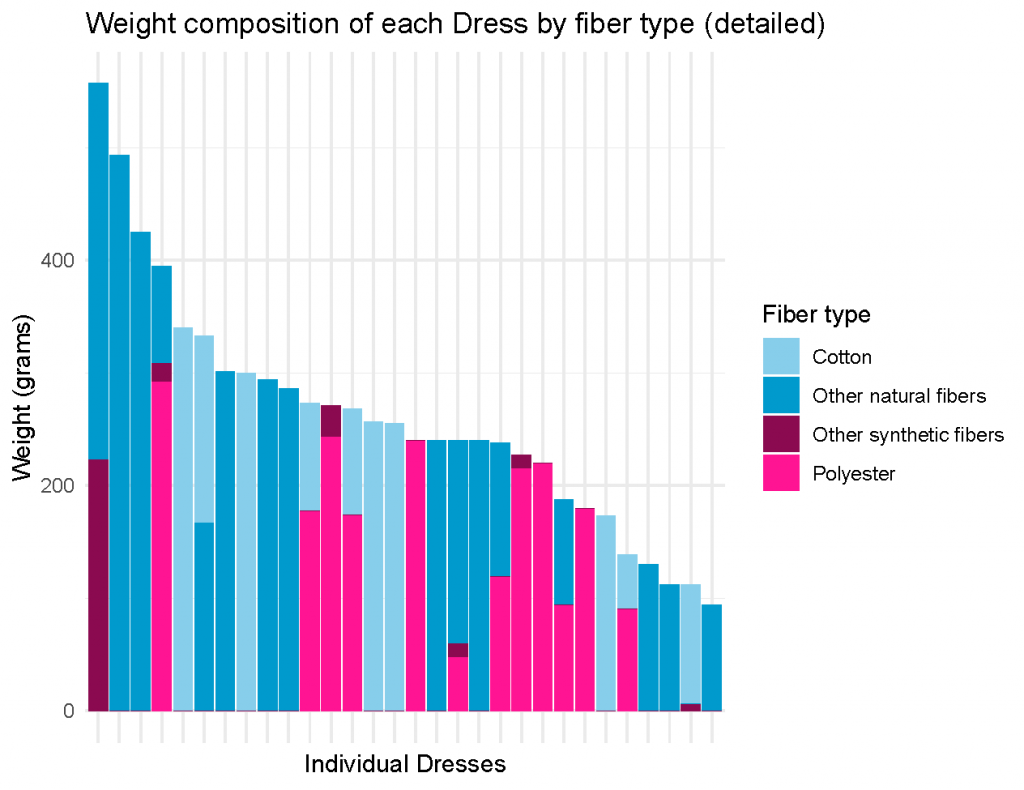
In Fig. 4, it is possible to observe how the weight of dresses varies considering their textile composition. It is worth noting that, on average, dresses made mostly from synthetic fibers, especially polyester, are located on the right side of the graph as their weight is lower (around 200 grams) compared to dresses made mostly from natural fibers like cotton, wool, and viscose, which tend to cluster on the left side of the graph because their weight is greater. This emerged also when running a T-Test: the average weight of natural fibers in “Dress” is 1.01 (p< 0.001) grams higher than the average weight of synthetic fibers.
By looking at the composition of one garment category, it is also interesting to observe the behavior of the fiber types. It emerges that there are some heavier observations where polyester, or other synthetic fibers, constitute most of the garment’s weight. This shows how weighing a garment is not only about a fabric’s absolute density, but it depends also on their processing, they can be thicker or thinner, impacting the final weight of the garment.
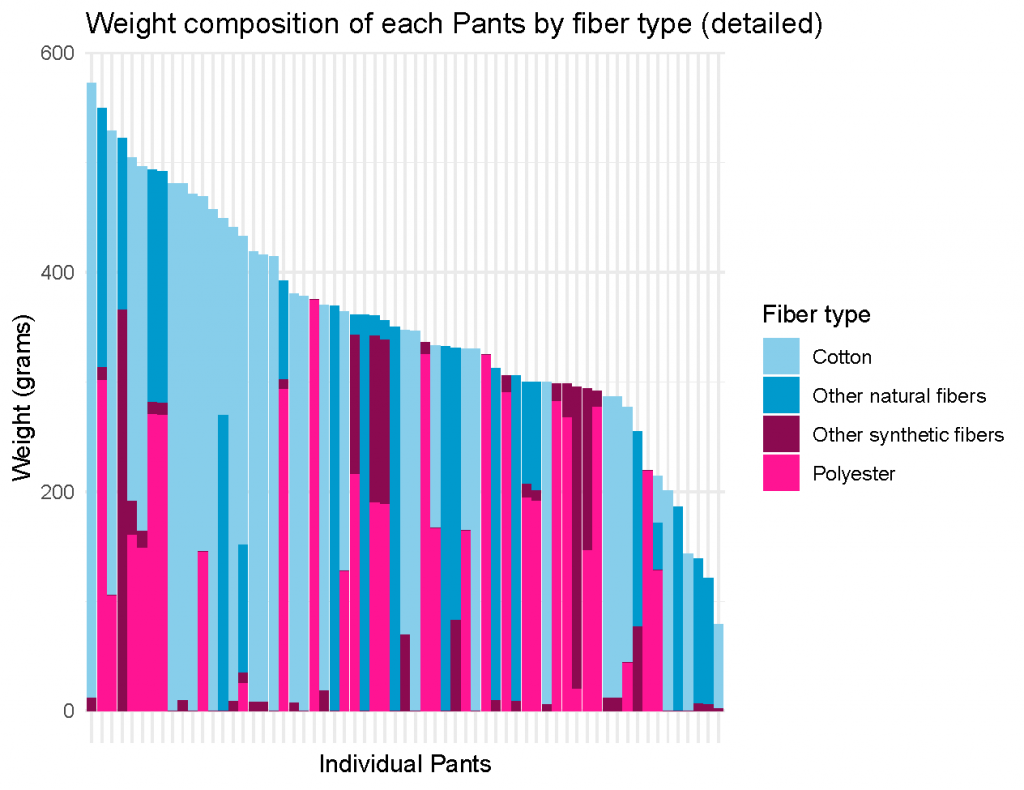
The same trend is observable in Fig. 5, where the “Pants” clothing category is taken into consideration. From this graph, it can also be observed that, on average, pants made mostly from synthetic fibers, particularly polyester (represented in the graph by the pink color), are lighter and occupy the area on the far right of the graph, with an average weight of around 300 grams. On the other hand, pants whose composition is mostly made of natural fabrics, especially cotton, but also other natural fibers, are located on the far-left side of the graph, having a greater weight (with some observations exceeding 500 grams). In this case as well, the T-test also suggests that: the average weight of natural fibers in “Pants” is 1.10 (p < 0.001) grams higher than the average weight of synthetic fibers. Again, it is important to remember the importance of the processing of a specific material, which can lead to the production of fabrics that are either thicker or thinner, resulting in different final weights.
Table 1: ANOVA and Post-hoc Tukey Test Results by Clothing Category and Fiber Composition
| Post-hoc Tukey Test | ||||
| Clothing Category | ANOVA P-Value | Mostly Natural/ Mixed Material | Mostly Synthetic/ Mixed Material | Mostly Synthetic/ Mostly Natural |
| Jackets | 0*** | -4.074 | 29.502*** | 33.576*** |
| Heavy Lower wear | 0*** | 153.118*** | -195.682*** | -348.801*** |
| Pyjamas | 0.0033** | -9.978 | -48.152** | -38.173** |
| Underwear | Not Significant | Not Performed | Not Performed | Not Performed |
| Light Upper wear | Not Significant | Not Performed | Not Performed | Not Performed |
| Maternity Wear | Not Significant | Not Performed | Not Performed | Not Performed |
| Light Lower wear | Not Significant | Not Performed | Not Performed | Not Performed |
| Activewear | Not Significant | Not Performed | Not Performed | Not Performed |
| One-Piece | Not Significant | Not Performed | Not Performed | Not Performed |
| Heavy Upper wear | Not Significant | Not Performed | Not Performed | Not Performed |
| All | 0*** | -94.34265*** | -54.10098* | 40.24167* |
Note: ***p<0.01, **p<0.05, *p<0.1
Furthermore, to assess differences in garment weight across fiber categories a variable a one-way ANOVA followed by a post-hoc Tukey test was conducted considering the “Merged Clothing Type” variable. The analysis revealed statistically significant differences for “Jackets”, “Heavy Lower wear”, “Pyjamas”, and the overall sample (All), while other clothing categories did not show significant variation in their weight considering their fiber composition.
For “Jackets” garments made of mostly synthetic fibers were significantly heavier than those made of mixed material and mostly natural fibers. No significant difference was found between mixed material and mostly non-synthetic fibers.
In the case of “Heavy Lower wear” mostly natural-fibers items were significantly heavier than garments with mixed material and significantly lighter than mostly synthetic items. Moreover, mostly synthetic garments were also significantly heavier than mixed material counterparts.
For “Pyjamas”, mostly synthetic items were significantly lighter than those with mixed material and mostly non-synthetic. The difference between mixed material and mostly non-synthetic was not statistically significant.
For categories such as “Underwear”, “Light Upper wear”, “Maternity Wear”, “Light Lower wear”, “Activewear”, “One-Piece”, and “Heavy Upper wear”, no statistically significant differences were found between fiber categories, and thus post-hoc comparisons were not performed.
Finally, when aggregating across all clothing categories (All), significant differences emerged between all fiber categories: mostly non-synthetic garments were heavier than mixed material, and mostly synthetic garments were heavier than those composed mostly of natural fibers and lighter than mixed material items.
Lastly, to examine the contribution of fiber content to garment weight, a hierarchical regression model was employed (See Appendix Table 3). In the first step (Model 1), only the variable “Merged Clothing Type” was included, resulting in an adjusted R² of 0.619. In the second step (Model 2), “Synthetic Fiber” was added to the model, increasing the adjusted R² to 0.648. This indicates that the inclusion of “Synthetic Fiber” explains approximately 3% additional variance in garment weight. An ANOVA comparison between the two models confirmed that this increase in explained variance was statistically significant, showing that synthetic fiber content contributes significantly to predicting garment weight beyond the effect of textile category alone.
Conclusions
The aim of this analysis was to try to understand whether garments made predominantly from synthetic fibers generally weigh less than those made from natural fibers. The motivation behind this research question lies in the fact that the issue of weight-based eco-modulation in textile policies, especially in relation to natural fibers, is an important yet underexplored topic, with practical implications for the fashion industry. From the results it emerges that, on average, especially for some clothing categories, garments made mostly of natural fibers tend to weigh more than those made of synthetic fibers, suggesting that it is important for weight-based policies regulating production in the textile industry to also consider the different types of materials used in garment production in order to achieve better effectiveness. Although it is important to keep in mind a limitation of this analysis: this study does not consider the density differences between the materials since the identity itself is not a proper indicator of the fiber weight of every particular garment. Indeed, the textile final weight would depend also on the physical and chemical processes through which the fibers are processed. This work, however, aims to serve as a starting point for exploring a topic that is still little discussed and that could be further investigated in the future. Additionally, other related themes could be explored, such as the relationship between garment weight, fiber composition, and gender, or how the composition of different fabrics affects the durability of garments.
References
Bédat, M. (2022). As quoted in Friedman, V. (2022, October 14). New York could make history with a fashion sustainability act. The New York Times.
Bukhari, M. A., Carrasco-Gallego, R., & Ponce-Cueto, E. (2018). Developing a national programme for textiles and clothing recovery. Waste Management & Research, 36(4), 321-331.
Changing Markets Foundation. (2021) Fossil Fashion: The Hidden Reliance on Fossil Fuels; Utrecht, The Netherlands. Retrieved from: https://changingmarkets.org/report/fossil-fashion-the-hidden-reliance-of-fast-fashion-on-fossil-fuels/
Chen, X., Memon, H.A., Wang, Y. et al. Circular Economy and Sustainability of the Clothing and Textile Industry. Mater Circ Econ 3, 12 (2021). https://doi.org/10.1007/s42824-021-00026-2
Hearle, J. W., & Morton, W. E. (2008). Physical properties of textile fibres. Elsevier.
Henry, B., Laitala, K., & Klepp, I. G. (2019). Microfibres from apparel and home textiles: Prospects for including microplastics in environmental sustainability assessment. Science of the total environment, 652, 483-494.
Lifset, R., Kalimo, H., Jukka, A., Kautto, P., & Miettinen, M. (2023). Restoring the incentives for eco-design in extended producer responsibility: The challenges for eco-modulation. Waste Management, 168, 189-201.
Muthu, S. S., Li, Y., Hu, J. Y., & Mok, P. Y. (2012). Quantification of environmental impact and ecological sustainability for textile fibres. Ecological Indicators, 13(1), 66-74.
Sigaard, A. S. (2023). Want Not, Waste Not: Preliminary findings. Consumption Research Norway (SIFO).
Simas, M. S., & Arega, M. A. (2025). From local strategies to global sustainability: A macroeconomic analysis of Extended Producer Responsibility scenarios for the Norwegian consumer textiles sector.
Watson, D., Kiørboe, N., Palm, D., Tekie, H., Harris, S., Ekvall, T., Lindhqvist T. & Lyng, K. A. (2014). EPR systems and new business models: reuse and recycling of textiles in the Nordic region. Nordisk Ministerråd.